MSTY ETF: The High-Yield Rollercoaster That Paid Me $20,000 in a Month

If you’ve been following along, you’ll remember that back on 8 May 2025, I broke down how MSTY YieldMax II ETF delivered me a tidy $21,448 gain, all while twitching like a caffeinated squirrel on a crypto chart. Read the original breakdown here.
Since then? Well… MSTY didn’t sit still. It never does. This isn’t your nan’s vanilla dividend ETF. MSTY is pegged to MicroStrategy (MSTR) — the bitcoin-obsessed software company that thinks corporate treasury should look like a Coinbase wallet.
Between 8 May and 18 June 2025, MSTY did what it does best: it paid out income like a broken ATM… and it dropped in price like a rock tied to a yield certificate.
So let’s answer the big question:
What happened to MSTY during this 27-day window of market mayhem? And more importantly — was it worth holding on?
I’m 4,200 MSTY Shares Deep — Here’s What It Looks Like (So Far)
Right — let’s clear this up straight away:
This isn’t financial advice. I’m not your adviser. I’m not your broker. And I’m definitely not that bloke in a Telegram group shouting “BUY THE DIP” at 1am.
What follows is my strategy. My rules. My capital. My tax bill. If it makes sense to you, great — but this is just how I handle MSTY YieldMax II ETF in a way that works for my risk appetite, my goals, and my (very real) fear of overtrading like a crypto degen in a caffeine spiral.
The method? Simple.
I call it: Set. Stack. Monitor.
Step 1: Set – Lock in the Game Plan
📅 One trade per month. No exceptions.
No FOMO. No chasing green candles. No trying to time the top or bottom.
I pick one day each month, buy my MSTY, and move on. That single, pre-planned trade saves me brokerage, decision fatigue, and mental tail-chasing.
🔻 I buy on the ex-date.
That’s the day after the record date. Why? Because MSTY usually drops post-dividend (it’s priced in), which gives me a cleaner entry — and a tighter dollar-cost average. Think of it like buying the dip... on schedule.
Step 2: Stack – Reinvest Smart, Not Blind
💰 I started with an initial capital base — in my case, from a property sale. I earmarked 25% of the proceeds (about $100k) for MSTY.
But I didn’t throw it in all at once.
I deployed that $100k over 2–3 months. Why? Because if the market cops a left hook, I want dry powder. Going all in upfront leaves you cornered — and out of cash.
🔁 Reinvest distributions... but stay tactical.
Yes, I use income to buy more MSTY. But I’m not blind about it. Every distribution I get, I take 45% straight off the top for tax.
Why 45%? My average tax rate’s around 40%, and I pad it with a 5% buffer. MSTY doesn’t come with franking credits — just raw, assessable income. So I treat every payment like a pre-tax wage.
📎 Here’s a quirk that trips people up:
Some of MSTY’s “yield” might include Return of Capital (ROC). That’s not free money — that’s your own capital, coming back to you in a tuxedo. ROC lowers your cost base and boosts your capital gains bill when you eventually sell. It’s tax-deferred now... but future-you might get a surprise when you lodge that return.
Step 3: Monitor – Don’t Sleep on the Risk
Look, MSTY is not a gentle ride. It’s more like holding onto a mechanical bull that throws dividends while spinning sideways.
Here’s how I stay sane:
🔄 I stagger big positions.
If I’m deploying serious coin, I split it across several entries. If Bitcoin drops 30% the day after I go all in, I want to know I’ve still got a few bullets in the chamber.
🧠 I’m a Bitcoin maxi.
Which means I’m structurally bullish on MSTR (and therefore MSTY by extension). But being bullish doesn’t mean being blind. I’m well aware this strategy can get absolutely belted if volatility goes feral.
Why am I bullish on BTC? Simple: it’s the hardest money on the planet.
Do yourself a favour — watch a couple of Michael Saylor interviews on YouTube. You’ll either end up inspired... or buying a cold wallet.
📉 Capital gains are capped.
Remember — MSTY runs a covered call strategy. That means you collect premiums (the juicy yield), but if MSTR explodes upward, you’re not going with it. You get your slice, sure — but you won’t capture the whole rally. That’s the trade-off for cashflow.
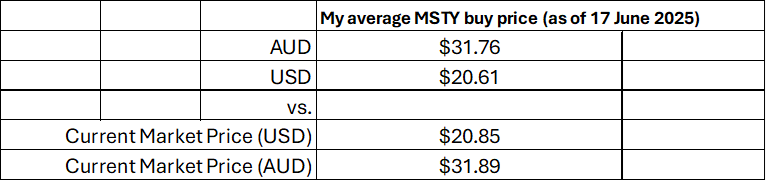
What my average MSTY buy price looks like vs current market price.
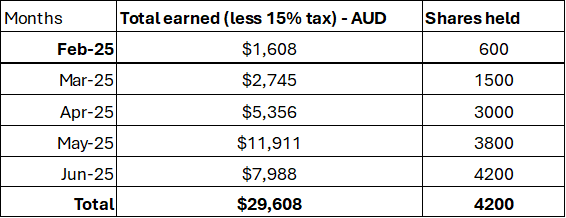
Next is looking at my distributions
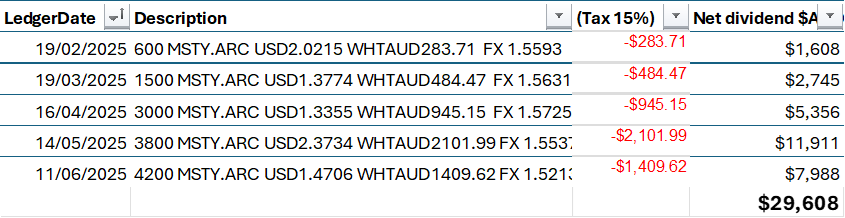
So total income looks like...
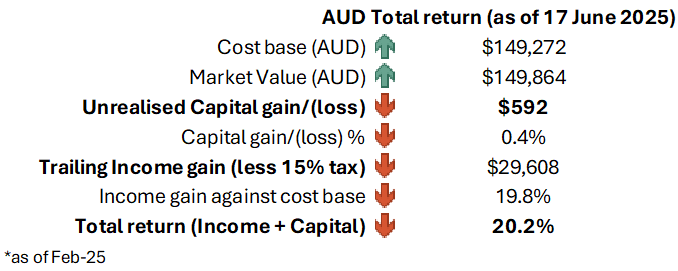
Now that all my numbers are laid bare, for the world to see, what does the total return look like?
From $23.54 to $21.13 — Not All Down Moves Are Bad
Let’s look at the scoreboard.
· 📈 Opening Price (May 8): $23.54
· 🔺 High (May 13): $23.85
· 🔻 Low (June 5): $20.27
· 📉 Closing Price (June 17): $21.13
· 🧮 Price Return: –10.2%
On the surface, that’s not pretty. A 10% haircut in less than a month? Most ETFs would get called to HR for less.
But MSTY isn’t here to win beauty contests. It’s here to generate yield by writing covered calls on a high-volatility asset (MSTR) and passing those premiums straight to your pocket. The drop in price? It wasn’t a bug — it was a feature of the strategy.
This isn’t a set-and-forget ETF. It’s a seatbelt-optional thrill ride that pays you for every bump in the road.
Up next? The part most people forget to check: the income.
Let’s run the numbers.
Dividends Didn’t Just Cushion the Fall — They Made It Worth It
While the share price tripped over itself like a Friday night trader on leverage, MSTY did what it was built to do: it paid out. Big.
Let’s talk income — because in the YieldMax playbook, it’s not just a feature, it’s the whole reason you showed up.
· 💸 May 8, 2025 Distribution: $2.3734 (paid May 9)
· 💸 June 5, 2025 Distribution: $1.4707 (paid June 6)
· 🏦 Total Payout in 27 Days: $3.8441 per share
Let that sink in. In less than a month, MSTY threw nearly $4 per share into holders’ accounts — during a period when the ETF’s price was dipping.
Now for the real kicker:
📈 Annualised Dividend Yield (TTM): 137.58%
That’s not a typo. That’s the raw power of MSTY’s synthetic covered call strategy. This ETF writes calls on MicroStrategy (MSTR), collects the option premiums, and hands them over to you, the shareholder. Like a Vegas casino handing out chips on the way out — except these actually clear.
In MSTY’s world, income isn’t a bonus. It’s the whole game.
The Number That Actually Matters: +6.1%
Now let’s zoom out. Forget the daily candles. Forget the FUD. What did MSTY actually return from May 8 to June 17, factoring in both price and payouts?
Here’s the math:
· 📉 Price Return = $21.13 – $23.54 = –$2.41
· 💰 Dividend Income = $3.8441
· ✅ Total Return = (–2.41 + 3.8441) / 23.54 ≈ +6.1% or $1.4341
That’s right. Despite a 10.2% drop in share price, investors ended the period ahead — thanks entirely to the dividend engine under the hood.
MSTY didn’t need price to win — it just needed time.
This Yield Isn’t Free. It’s Rented from Volatility.
Of course, none of this comes gift-wrapped in low-risk packaging.
📉 Drawdown: MSTY fell more than 10% in 27 trading days. That’s not passive income — that’s active turbulence.
🎯 Dependency: This ETF is tied to MicroStrategy (MSTR), which is tied to Bitcoin, which is tied to Elon Musk’s mood, halving cycles, and the full moon. You’re not buying Procter & Gamble here — you’re flying close to the sun with Icarus’s ETF cousin.
⚙️ The Strategy: MSTY earns yield by selling covered calls on MSTR. It’s synthetic, it’s high octane, and it’s brilliant — until volatility spikes, MSTR moons, or options premiums collapse. The trade-off? You give up upside in exchange for juicy, short-term income.
💡 Price Compression vs Payout: High distributions are great — until they start eroding the capital base. MSTY doesn’t shy away from this. The ETF is built to extract value in the short term, not to hold for five years while you forget the login to your broker account.
This isn’t a sleepy dividend stock. It’s a yield-chasing sports car on an options track.
MSTY is Not for Tourists
Let’s be clear: MSTY isn’t for everyone. This isn’t a park-your-cash-and-check-in-quarterly kind of ETF. It’s an instrument for those who understand the strategy — and can handle the turbulence.
This ETF may suit:
· Traders looking for monthly income from volatility
· Income-focused investors who are comfortable with price drawdowns
· Those who understand the correlation between options premiums and underlying risk assets like MSTR and Bitcoin
For MSTY’s eye-watering yield to remain sustainable, three things need to keep humming:
1. Volatility in MSTR (because option premiums love movement)
2. Strong options demand (to sell those juicy calls)
3. Continued investor appetite for income over upside participation
But let’s not sugar-coat it — volatility is both the fuel and the fire. When MSTR is tame, premiums shrink. When MSTR spikes, MSTY’s cap-limited strategy can miss the rally. It’s a balancing act between collecting cash and getting crushed.
Volatility is not the enemy. It’s the business model.
Paid to Hold. Paid to Watch. Paid to Think Twice.
Here’s the wrap-up:
📉 Price dropped 10.2%
💸 Dividends paid nearly $3.85 per share
📈 Total return came in at +6.1% over 27 trading days
The ETF did exactly what it said on the tin — it printed income in exchange for price swings. You didn’t need a bull market. You just needed a pulse on MSTR and a seatbelt.
So where do we go from here?
If MSTR keeps swinging — and Bitcoin keeps breathing — July could be just as lucrative… or just as wild.
Stay tuned. Same ticker. Same tension.
Quick MSTY Price and Dividend Data Table

Sources / Citations
· Digrin
FAQ: MSTY YieldMax II ETF (May–June 2025)
1. What exactly does MSTY invest in?
MSTY YieldMax II ETF is built around a synthetic covered call strategy on MicroStrategy Inc. (MSTR). It doesn’t hold MSTR directly—instead, it uses swap agreements and options contracts to replicate exposure and generate income through option premiums.
2. Why is the dividend yield so high?
MSTY generates income by selling call options on a volatile stock (MSTR). The premiums collected from these options are passed on to shareholders as distributions, resulting in high monthly payouts. In the latest period, the yield was annualising at over 137%, but keep in mind—this comes with significant price risk.
3. How can the total return be positive if the share price went down?
While MSTY’s share price dropped 10.2%, it paid out nearly $3.85 in dividends per share over the period. When factoring in these distributions, the total return for investors from May 8 to June 17 was approximately +6.1%.
4. What are the biggest risks of holding MSTY?
MSTY is highly volatile due to its link to MSTR and Bitcoin. It can experience sharp drawdowns, and the income strategy limits upside if MSTR rallies hard. There’s also the risk of capital erosion over time if distributions consistently exceed total returns.
5. Who is MSTY most suitable for?
MSTY may appeal to income-focused investors who understand options strategies and are comfortable with volatility, drawdowns, and crypto-linked price action. This ETF is built for active monitoring—not a “buy it and forget it” approach.
Cheers,
Stevo – Armchair Banker MAppFin, AdvDipFP, ADA
‘Meet Stevo, the financial wizard behind Armchair Banker. With 15 years of experience in investment banking, corporate finance, and markets, Stevo’s résumé is so impressive it could intimidate a spreadsheet.’
For more ‘Ah-ha’ money and finance guides visit www.armchairbanker.com and subscribe to our newsletter
Follow us on socials
Join our Facebook Community - https://www.facebook.com/armchairbanker
Or join our Reddit Community - https://www.reddit.com/r/ArmchairInvestor/
X - https://x.com/armchairbankr
Full Disclosure: Stevo may or may not hold this asset at the time of publishing. Using my provided links/affiliate links could result in a payment or fee discount for Stevo, helps keep the lights and refill his whiskey on the rocks mate.
DISCLAIMER: The information in this article does not constitute personal financial advice. Consult your adviser or stockbroker prior to making any investment decision.
MORE DISCLAIMERS: Stevo is not a Financial Adviser, however, works as an Investment Banker assisting ASX listed companies with retail capital raises. All opinions expressed and written by Stevo, including all other ‘Armchair Banker’ contributors is for informational and entertainment purposes only and should not be treated as investment or financial advice of any kind. Any information provided from our articles, blogs and written opinions is general in nature and does not take into account your specific circumstances. Armchair Banker and its contributors are not liable to the reader or any other party, for the reader’s use of, or reliance on, any information received, directly or indirectly, from any content by Armchair Banker in any circumstances.
The reader should always (we’re serious about this):
1. Conduct their own research
2. Never invest more than they are willing to lose
3. Obtain independent legal, financial, taxation and/or other professional advice in respect of any decision made in connection with this video/article.